
In last month’s article, we introduced the five categories of metrics SaaS leaders should monitor before scaling their businesses.
Many founders and leadership teams then asked a practical follow-up question:
“What are the actual metrics behind those signals, and how do you calculate them?”
This article answers that question.
It shares the specific metrics behind the five signal categories we discussed in The 5 SaaS Metrics That Matter Before You Scale in 2026, along with a downloadable spreadsheet that includes the formulas for calculating each one.
Of course, the formulas for most SaaS metrics are easy to find online. A quick search in Google, ChatGPT or Gemini will give you definitions for LTV, CAC, Rule of 40, or Burn Multiple.
However those metrics won’t tell you how experienced SaaS operators interpret those numbers when deciding whether a company is truly ready to scale. So from time to time the team at ThinkGo will share the occasional Founder's Hack's (like the one below) to help you out.
Founder's Hack
Many SaaS companies track dozens of metrics, but only a small number actually determine whether scaling will succeed.
Before accelerating growth, leadership teams should focus on the signals that predict:
- customer retention
- activation success
- repeatable sales
- organisational readiness for growth
The Five Metric Categories SaaS Leaders Should Watch Before Scaling
Scaling a SaaS company successfully requires more than revenue growth. It requires confidence that the underlying signals supporting that growth are healthy.
At ThinkGo, we group the most important signals into five strategic categories.
1. Leading Retention Indicators
Retention metrics provide early insight into whether customers are receiving sustained value from your product.
These indicators help SaaS leaders detect future churn risk before revenue numbers show it.
Key metrics include:
NPS (Net Promoter Score)
Customer Health Scores
DAU/MAU Ratio
Consumption Rate
Feature Adoption Rate
These are leading indicators, meaning they often predict customer behaviour before renewal outcomes become visible.
2. Activation Quality
Activation measures how quickly new users experience meaningful value after onboarding.
When activation is weak, scaling acquisition simply increases churn and customer acquisition costs.
Key activation metrics include:
TTV (Time to Value)
Customer Activations
Trial or Freemium Conversion Rate
Product Qualified Leads (PQLs)
These signals help leaders understand whether new customers are successfully reaching the critical 💡Aha! moment that drives retention.
3. Ideal Customer Profile (ICP) Sharpness
Not all revenue is equal.
Scaling with poorly matched customers creates churn, complexity, and margin pressure.
ICP metrics help confirm that the customers you are attracting are aligned with your business model.
Key metrics include:
LTV (Customer Lifetime Value)
ACV (Annual Contract Value)
ARPA (Average Revenue Per Account)
TAM / SAM / SOM (Market sizing indicators)
These metrics help leadership teams confirm whether the target market supports long-term profitability and sustainable growth.
4. Repeatability of Sales
Founder-led sales often work in early-stage companies.
But before scaling, leadership teams must confirm that the sales engine is repeatable and efficient.
Important sales efficiency metrics include:
LTV / CAC Ratio
CAC Payback Period
Customer Acquisition Cost (CAC)
Lead-to-Close Conversion Rate
Sales Qualified Leads (SQL)
Marketing Qualified Leads (MQL)
Together, these metrics reveal whether your growth engine is scalable, or dependent on founder heroics.
5. Growth Readiness and Misalignment Signals
Even when product and market signals look strong, scaling can fail if the organisation itself isn’t ready.
These metrics help detect internal misalignment and operational strain before it slows growth.
Key indicators include:
ThinkGo Diagnostics Score
Internal Misalignment Index
Voluntary Employee Churn
Employee Ramp Time
Burn Multiple
Rule of 40
These signals help leadership teams understand whether their organisation has the structural capacity to support rapid growth.
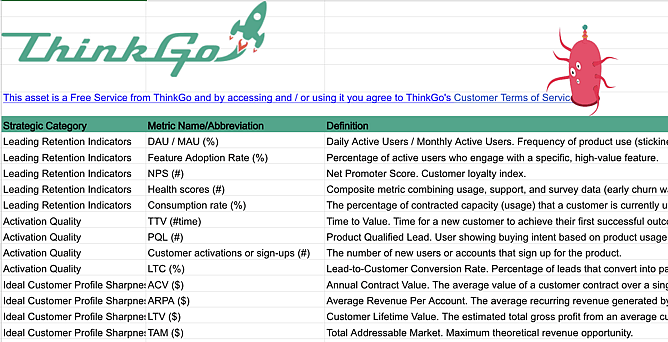
Download the SaaS Metrics Spreadsheet (With Formulas)
To make these metrics easier to use, we’ve created a downloadable spreadsheet that includes:
the metrics listed above
a short description of each metric
the formula used to calculate it
Your leadership team can use it to build dashboards, financial models, or internal diagnostics.
You can download the SaaS Metrics Spreadsheet here 👇👇👇
Why Metrics Alone Aren’t Enough
Metrics are useful, but on their own don’t tell you what to do.
What matters is how those numbers move together, what they reveal about product-market fit, and whether your organisation is ready for the next stage of growth.
Because scaling a SaaS business successfully isn’t about tracking more metrics.
It’s about understanding which signals actually matter.
Enjoy the resource. We hope it helps bring clarity to the signals behind your growth.
Devin & the ThinkGo team